Overview
Once your outcomes data is uploaded, you can customize how your public-facing Outcomes page looks and what it says. This includes updating your page title and description, adding a header image, and choosing which charts appear on the page. These settings let you present your institution's outcomes story in a way that reflects your brand and speaks to your audience.
|
📌 Please Note Chart Titles & Descriptions and Page Settings are ODV-only tabs. Customers without the ODV module will see these tabs as locked. |
Accessing Chart Titles & Descriptions
- Log in to your admin dashboard and navigate to Analyze > Student Outcomes.
- Click the Chart Titles & Descriptions tab.
Customizing Your Page Title and Description
- In the Chart Titles & Descriptions tab, locate the Page Title field.
- Enter the title you want to appear at the top of your public Outcomes page (e.g., "Where Our Graduates Go" or "[Institution Name] First Destination Outcomes").
- In the Page Description field, enter a brief introduction to your outcomes page. This text appears near the top of the page, above the charts and filters.
- Click Save Changes.
|
💡 Pro Tip Your page title and description are often the first things a prospective student or parent reads when they land on your Outcomes page. Clear, welcoming language that speaks to your institution's commitment to student success tends to resonate well. |
Adding a Header Image
- In the Chart Titles & Descriptions tab, locate the Header Image section.
- Upload an image that reflects your institution's brand — campus imagery, career fair photos, or students in professional settings all work well.
- Click Save Changes.
|
📌 Please Note For best results, use a high-resolution image in landscape orientation. Your web or marketing team may have approved imagery that works well for this use case. |
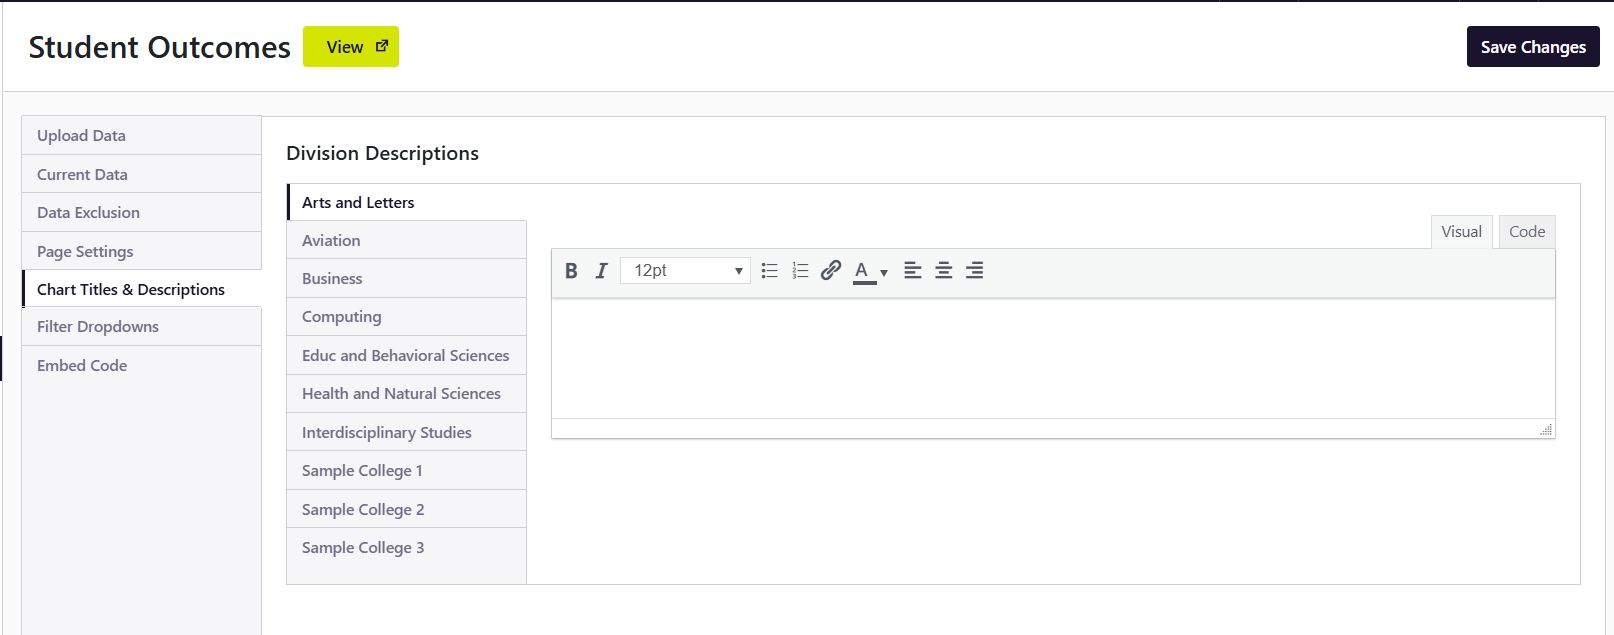
Customizing Individual Chart Titles and Descriptions
Each chart on your Outcomes page has its own title and optional description that you can customize.
- In the Chart Titles & Descriptions tab, scroll to find the chart you want to update.
- Edit the chart title to match your institution's terminology (e.g., "Knowledge Rate" instead of "Employment Rate" if that aligns with how your institution tracks outcomes).
- Add an optional description beneath the chart title to provide context for that data point.
- Click Save Changes.
Accessing Page Settings
- Navigate to Analyze > Student Outcomes.
- Click the Page Settings tab.
 Configuring
Which Charts Are Displayed
Page Settings lets you control which charts appear on your public Outcomes page. This is useful if certain chart types are not applicable to your data or if you want to simplify the page for a specific audience.
- In the Page Settings tab, review the list of available charts.
- Toggle individual charts on or off using the visibility controls.
- Click Save Changes.
|
💡 Pro Tip Less is often more on an Outcomes page. If certain charts consistently show limited data (due to your institution's data set or minimum pool size), consider hiding them to keep the page clean and focused on your strongest data stories. |